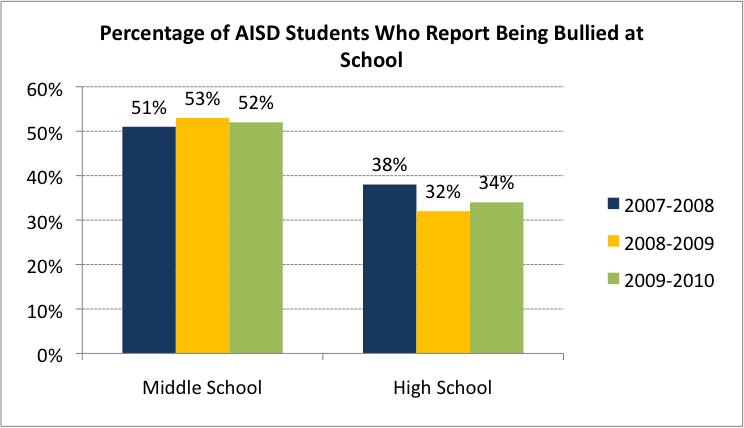
The first graph comes from the AISD ( Arlington Independent School District) which it is located in the state of Texas. In this we can see the percentage of people who had reported being bullied at school, dividing it between middle and high school. So it definitely shows that people from middle school (who tend to be more immature) are the ones with more bullying cases. In both parts of the graph which shows the middle and high school statistics we have different patterns that provides us with useful information about the anti-bullying campaigns in schools.
In middle school we can see that since the years (2007-2008) to (2008-2009), the cases of bullying had risen up a 2%, and to (2009-2010) it decreased only 1%.
On the other hand, we have high school, which shows that from a 38% that they had of bullying cases in (2007-2008) they decreased to a 32% in (2008-2009), and finally risen a 2% for the (2009-2010) years.
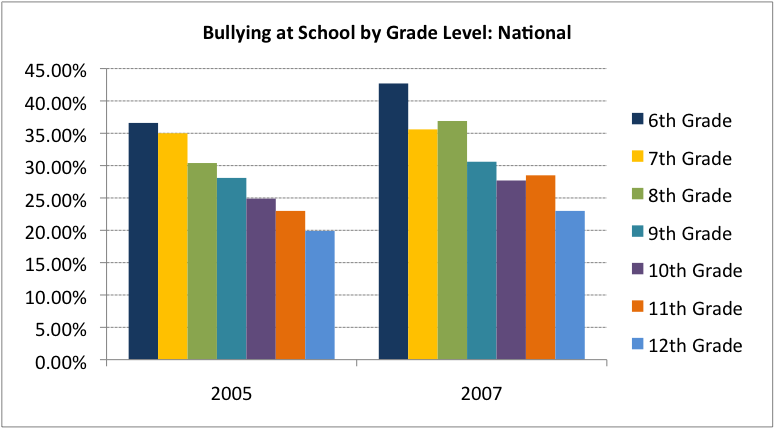
In this second graph, it is showed statistics from the United States. It is divided by different years which are 2 years apart from each other. They show us the percentage of bullying in these two years and the grades in which bullying happens the most.
First, I will analyze the year 2005. In this we could easily notice that the pattern is the decreasing of bullying over the school grades.
In the year 2007 we have a more difficult pattern, because even though it as well decreases ... the 6th, 8th and 11th grade rises. I think this happens because it happens that these years also mean a new beginning (6th) or an ending (8th and 11th) of a facet in their teenager´s life.
So in a brief conclusion I think that by comparing both years I could say that the year 2007 seems to be much more difficult than 2005, i think this had happened because of the teens insecurity as well as their need to show their ¨coolness¨ using bullying and trying to make the others feel worse than them.